PeekPanda docs
Leaderboards
Read the daily Apple charts by country, shelf and chart type, and understand what a rank movement means.
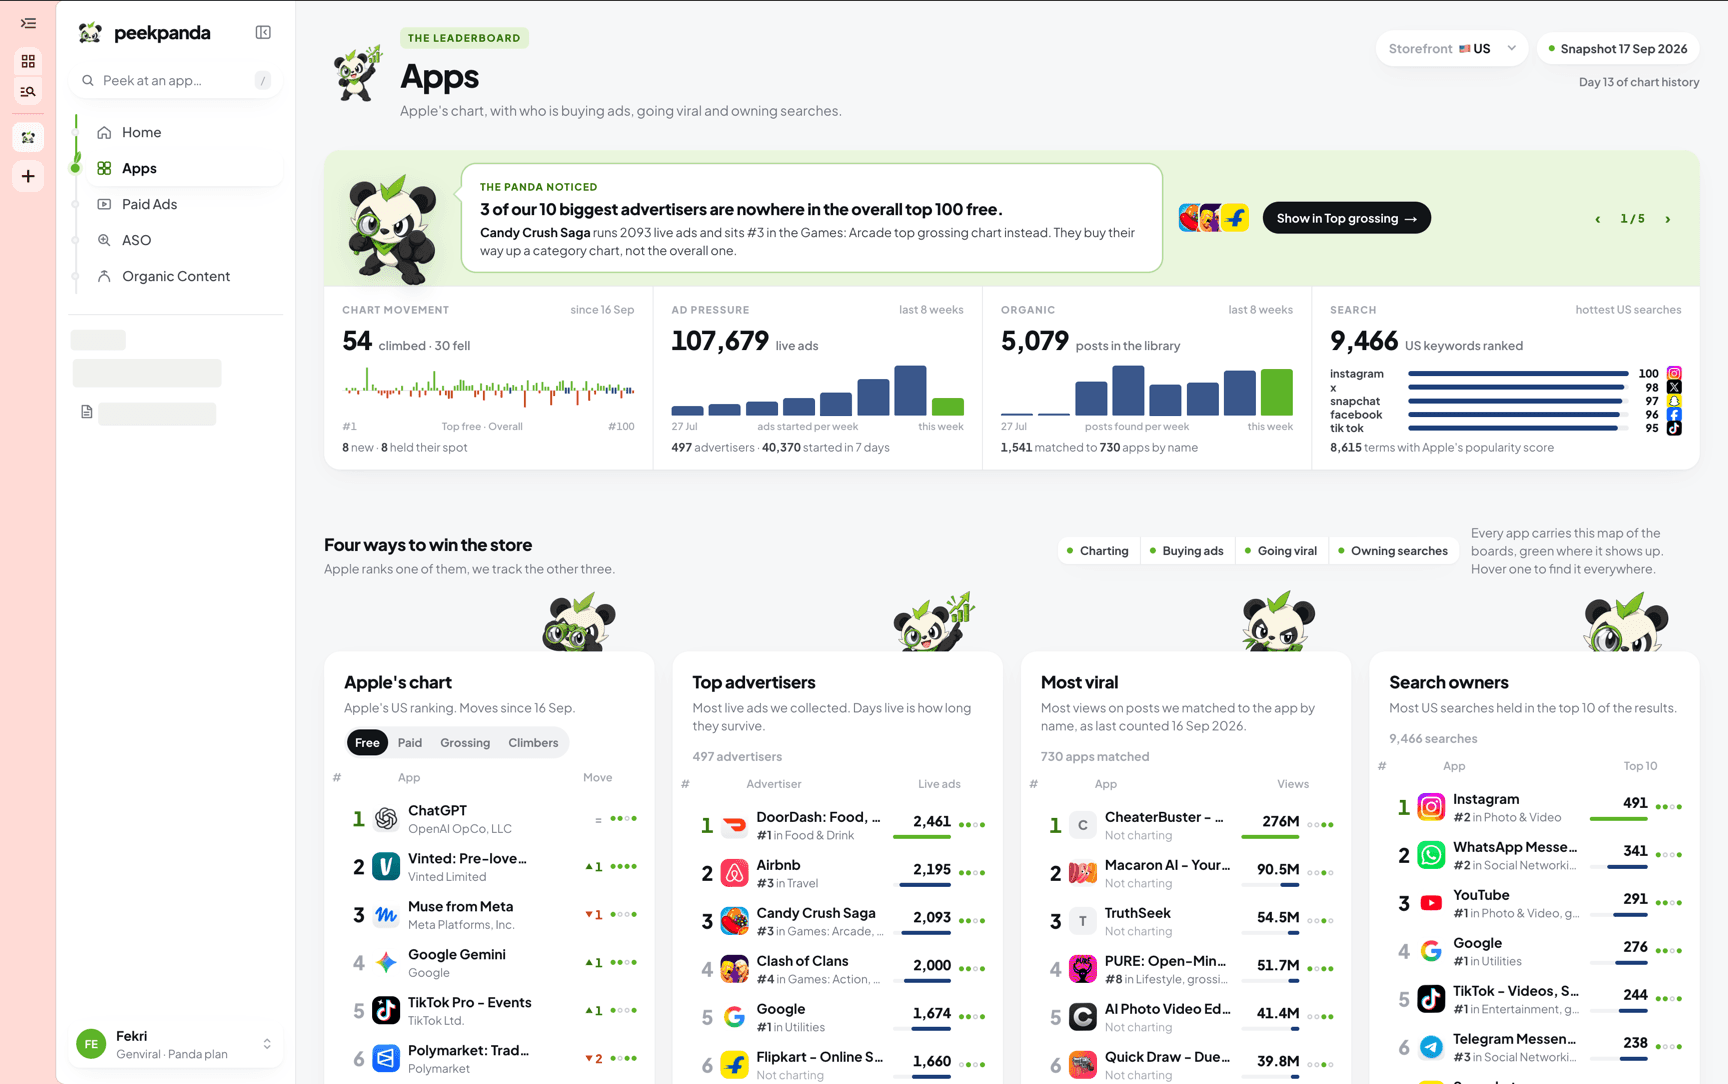
Download Markdown ↓/apps is the leaderboard board. It shows one collected Apple chart at a time: one country, one shelf, one chart type. Apps in the sidebar opens it.
Chart reads never call Apple. You are always reading the most recent collected snapshot, and the board says which day that is.
Choosing a chart
Four controls sit above the table, and all four live in the URL.
- Country. Collection covers six storefronts: United States, United Kingdom, France, Germany, Brazil and Belgium.
- Shelf. Overall, plus the 27 App Store categories.
- Chart type. Top free, Top paid, Top grossing.
- View. Rankings, Gainers, Losers, New entrants, New releases. Each carries the number of rows it would show.
A chart outside that coverage is not served. The board asks you to pick from the current controls instead of showing an empty table.
Up to 100 rows are returned for a chart.
What the views mean
| View | Rows it keeps |
|---|---|
| Rankings | Every ranked app, in the chart's own order |
| Gainers | Apps that moved up since the previous collected day, biggest climb first |
| Losers | Apps that moved down since the previous collected day, biggest drop first |
| New entrants | Apps on this chart today that were not on the previous collected day |
| New releases | Apps released within 30 days of the snapshot day |
New entrants is empty until there is a previous collected day to compare against. New releases is about the release date on the listing, not about the chart, so an old app that just entered the chart is a new entrant and not a new release.
Freshness
A mark next to the view switch says where the snapshot stands.
- Fresh. The snapshot is current. Hover it for the day it was observed.
- Stale. More than 30 hours have passed since the chart was last read.
- No collection. No snapshot exists for this chart yet.
When a chart has been collected exactly once, the board says so: The first snapshot is in. Movement appears after the next daily collection. One day of data has no baseline to move against.
Reading a row
| Column | What it holds |
|---|---|
# | Today's rank, with the movement beside it |
| App | Icon, name, developer |
| Category | The category on the listing |
| Downloads est. | Estimated monthly installs, with change since the previous observation |
| Revenue est. | Estimated monthly revenue, with change since the previous observation |
| Rank trend | The app's collected ranks on this chart, up to the last 30 days |
| Rating | Star rating and rating count |
| Released | How long ago the app was released |
Both estimate columns are estimates. Downloads are derived from rating counts, never a measured download number, and revenue is derived from an observed grossing position. A dash means nothing was stored, not zero. Revenue and download estimates has the method.
The rank trend line connects consecutive collection days only. A gap in collection stays a gap rather than a straight line across it.
Click the rank to open rank history for that app on that chart. Click the app to open its case file, or, when the app is not in the catalogue, its App Store page.
What a rank movement means
Movement compares today's rank with the app's rank on the previous collected day for this exact chart: same country, same shelf, same chart type.
| What you see | What it means |
|---|---|
▲ 12 | The app climbed 12 positions since the previous collected day |
▼ 4 | The app fell 4 positions |
· | It held its position, or there is no previous observation to compare |
New | It was not on this chart on the previous collected day |
Two things are worth keeping straight.
A movement is a change in position, not a change in performance. An app can climb because the apps above it fell. The number tells you the chart moved; it does not tell you why.
Grossing rank is a position, not dollars. A top grossing chart orders apps against each other. It carries no revenue figure of its own.
Movement is only defined between two collected days. If a day was not collected, the comparison skips to the last one that was, and a first snapshot has no movement at all.
Sorting
Rank, Downloads est., Revenue est., Rating and Released are sortable. Click a column to sort by it, click again to reverse. The sort is in the URL as sort=, with a leading - for descending, so a sorted board is a link you can send.
Rows with nothing collected for the sorted column always sit at the end, in both directions, so a missing number never reads as the smallest one. Ties keep the chart's own order.
Sorting reorders the rows already on the page. It does not fetch a different set of apps.
The insight panel
Beside the table, four cards summarise the chart you are looking at:
- Category mix. How the ranked apps split across categories. The five largest are named and everything smaller is collected as Other, so the counts still add up.
- Release age. How old the ranked apps are.
- Category leaders. The number one app on the most recent collected chart of each shelf, for the country and chart type you are on. Overall is left out. Click one to switch shelf.
- Store coverage. For each of the six storefronts, the day this shelf and chart type were last collected and how deep the chart was read. Click one to switch country.